Category: Explainers / data visualization

All 38,388 of LeBron James’ points, in six charts

Allen Iverson was a ruthless ankle breaker and a revolutionary cultural icon | The Class of ’96

The Raptors’ dino jersey became a classic — with a little help from Vince Carter | Threads

Steph Curry’s historic NBA Finals performance, in four charts | Stat Stories

How Damian Lillard extended his range to make logo shots routine | Signature Shots

Desmond Howard hit the Heisman pose because no one else had a chance to win | Heisman Moments

Here’s why the Steelers should not pay Le’Veon Bell
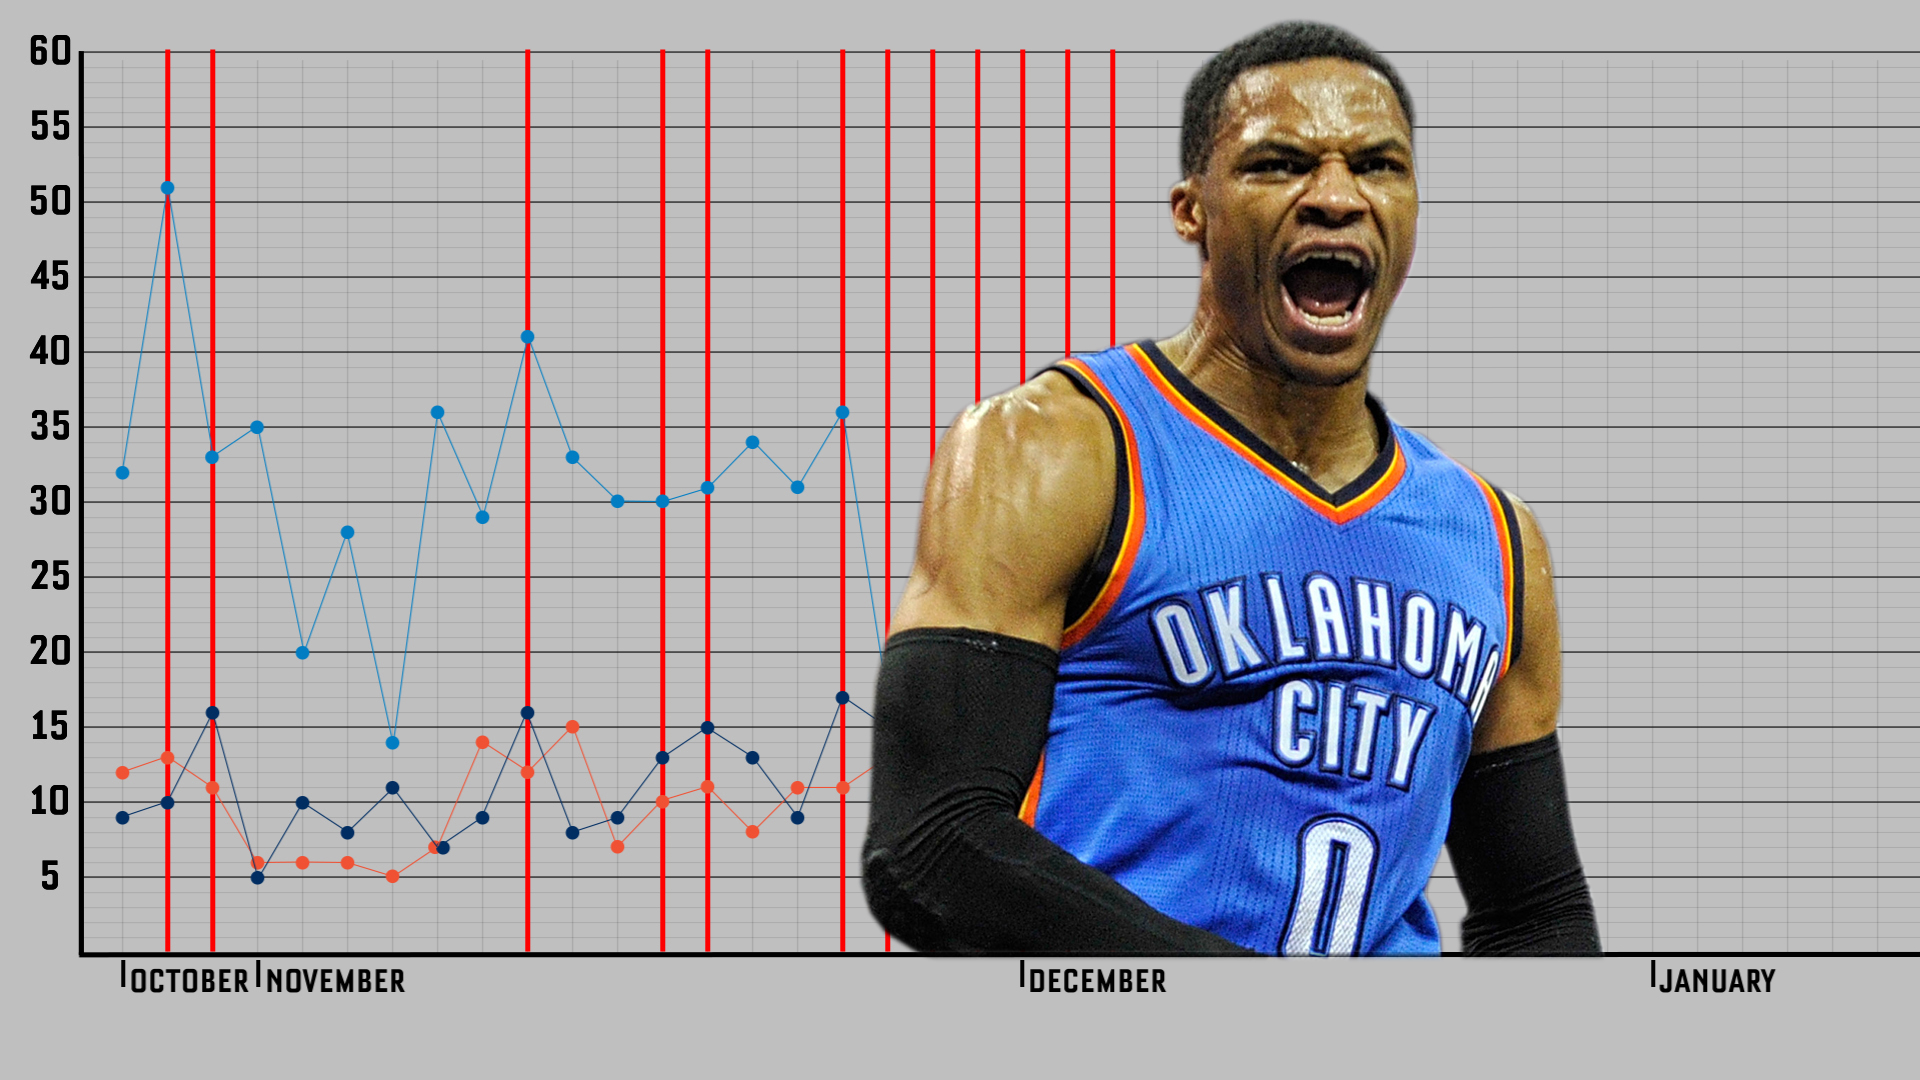
Russell Westbrook’s historic season, in one chart
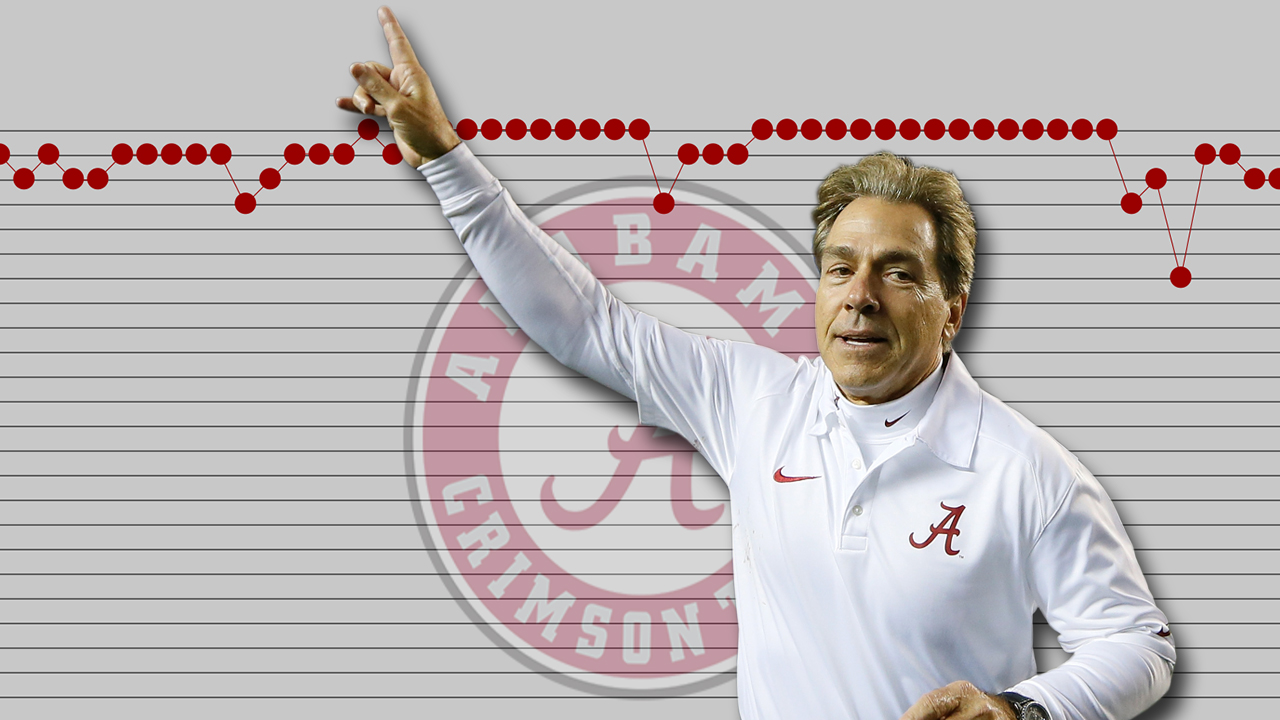
Nine years of Alabama dominance, in one chart
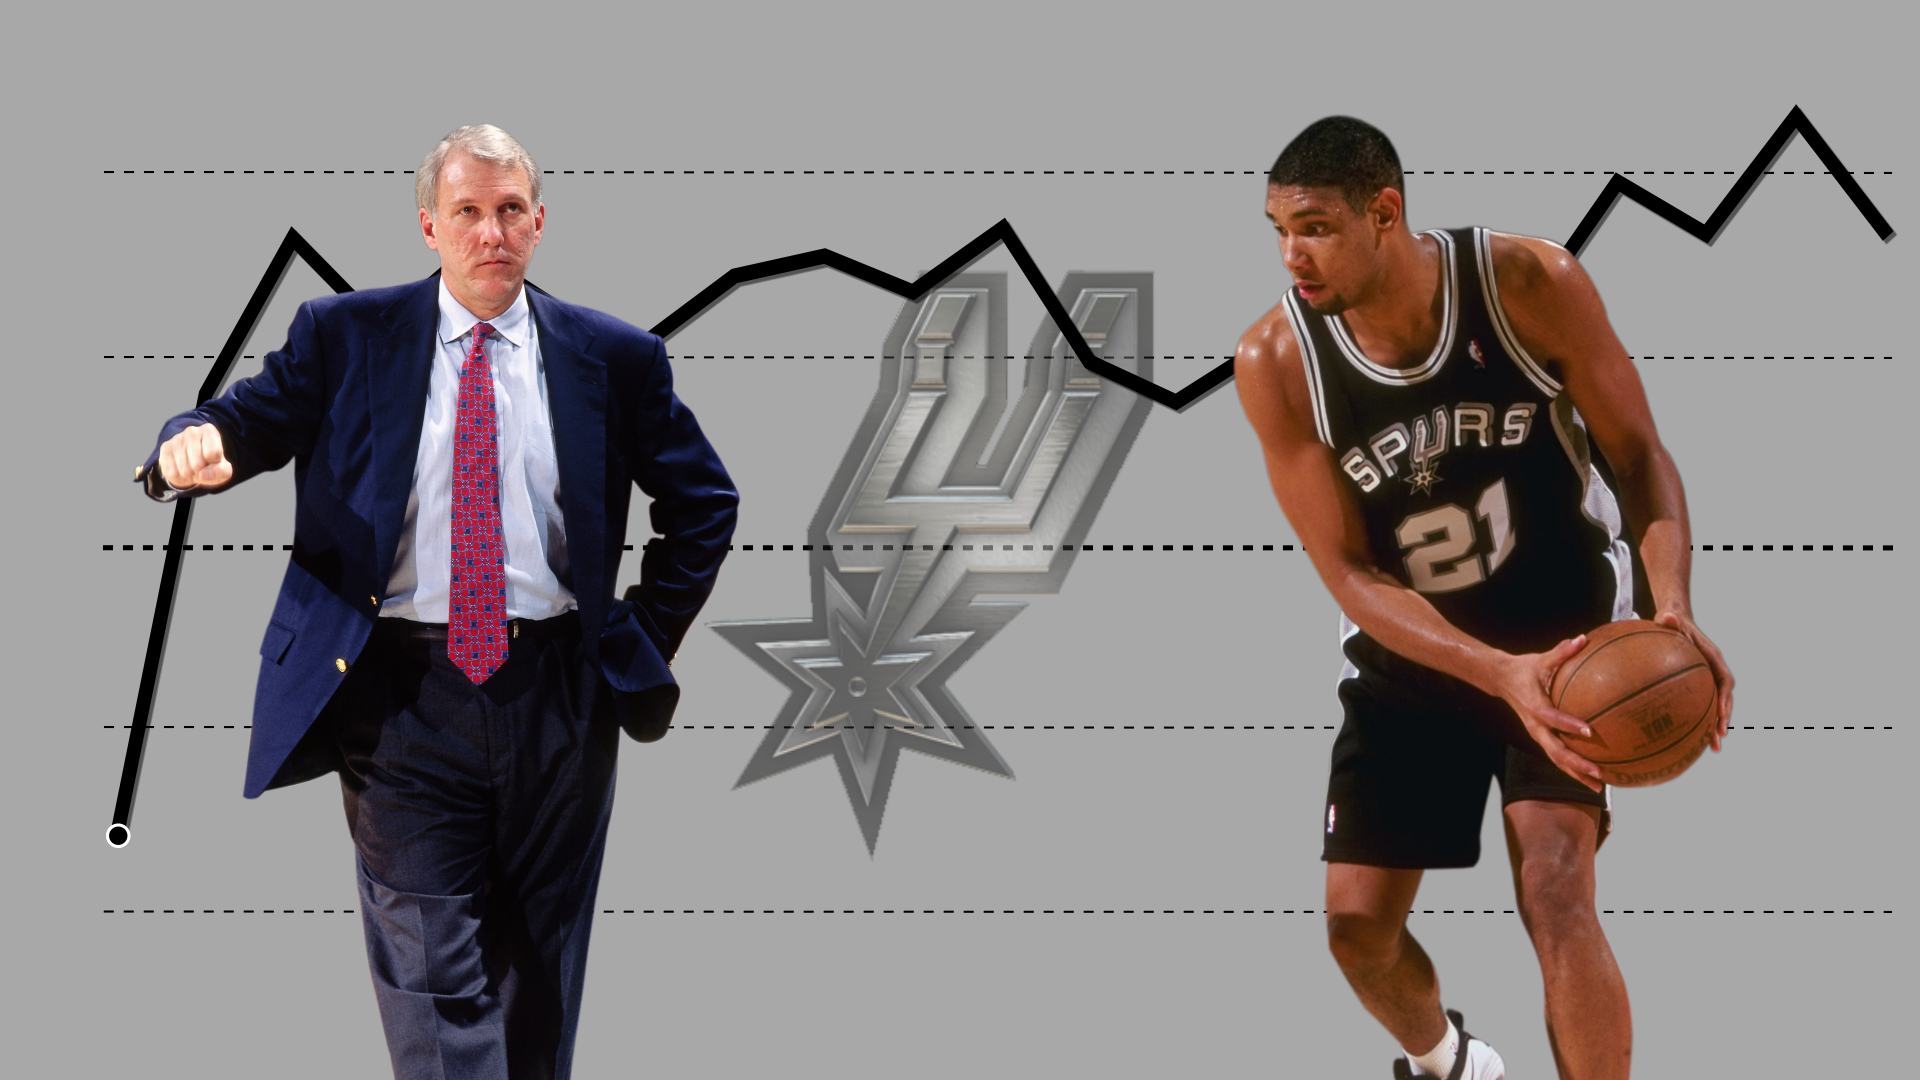
The consistent excellence of the Spurs
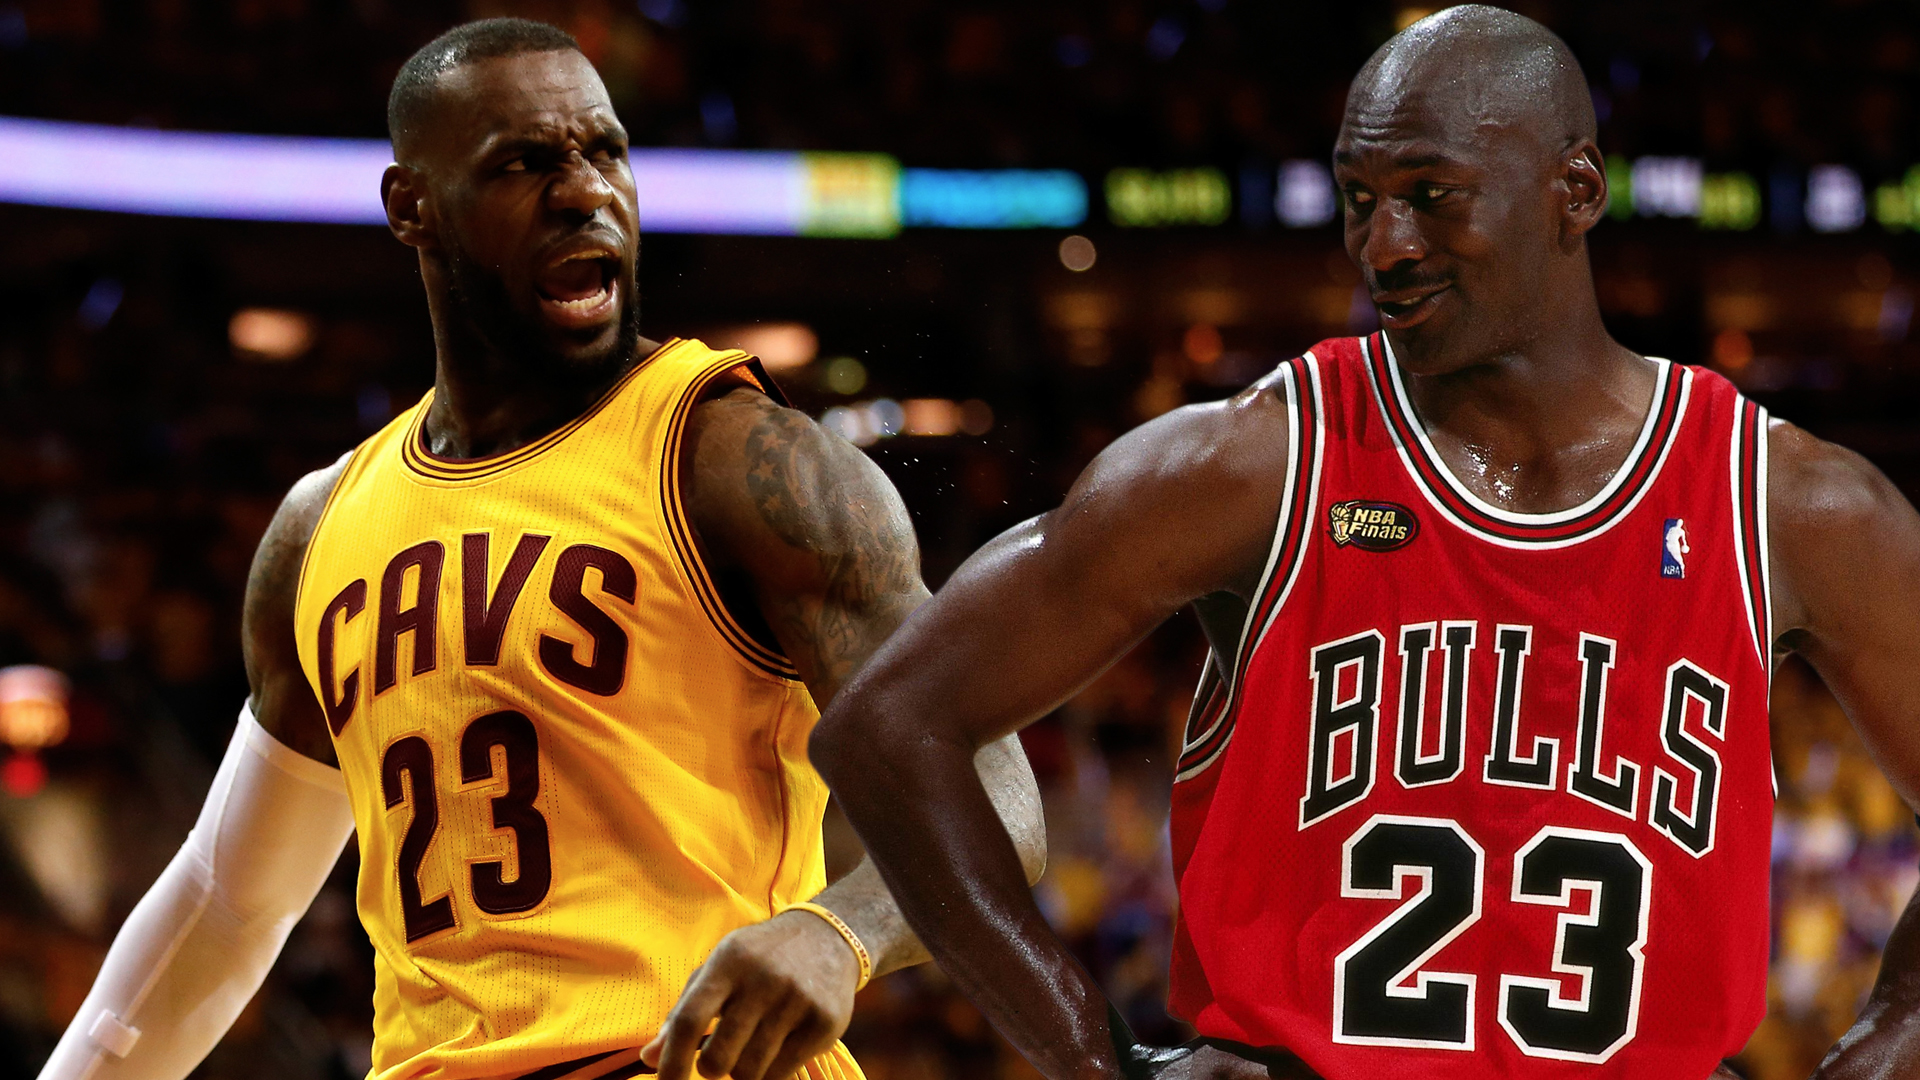
Better playoff scorer: LeBron or Jordan?
